
We know it today as the Gantt Chart, but historical research credits a visual network diagram of inter-related activities was illustrated as early as 1896, by Karol Adamiecki. A Polish engineering and management researcher, Adamiecki developed the Harmonogram technique while working on steel mill production challenges1 in Poland & Russia at the turn of the 20th century.
What was the problem that the Harmonogram solved? Adamiecki’s job at that time was investigating plate steel mill production. Attempting to improve productivity. His observations led him to believe there were opportunities for improvement, but his initial attempts to implement these ideas were met with resistance from the work force. Being seen as an outsider with limited knowledge of that specific factory would cloud the openness to change. He needed a tool to help him communicate his observations and illustrate how change could lead to improved productivity. At that time there was no apparent right tool for the job. So, he invented one. The Harmonogram.
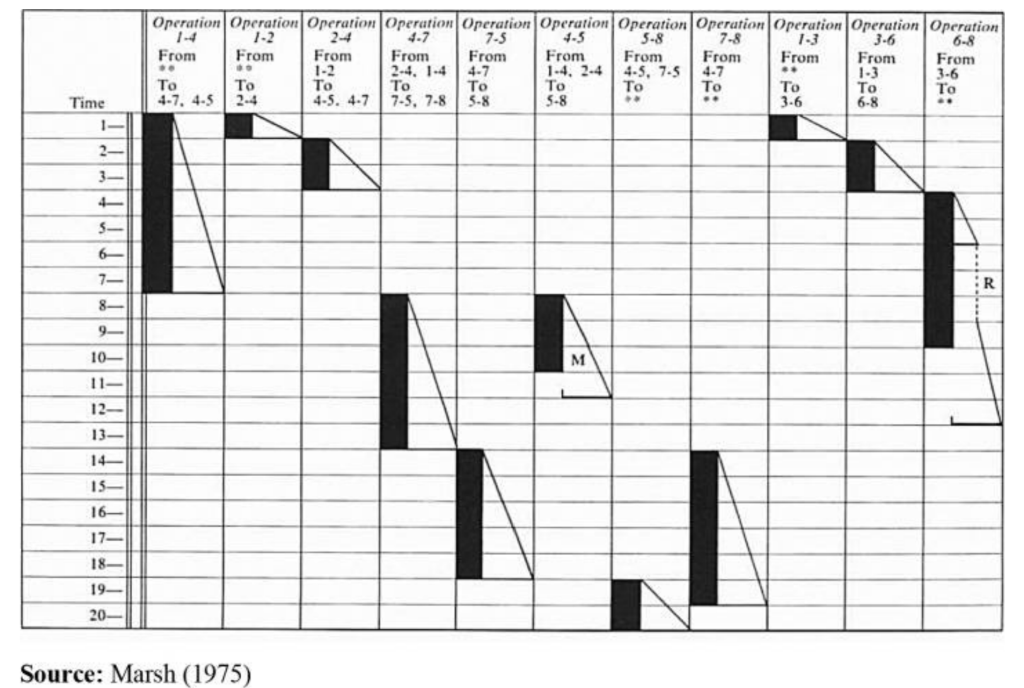
Creating a graphical representation of work activity, duration and relation to other operations he was able to illustrate where time and productivity was lost. This new tool, enable him to gain the influence necessary to implement changes, not just at his primary factory but also in Russia.
In the Western world, Henry Gantt is credited with the invention of this graphical tool. But both men developed their initial solutions from steel and manufacturing backgrounds. With the demonstrated success in the factory, taking their management principals and charts to other forms of industry was a natural next step. The idea of integrating activities and illustrating them graphically wasn’t only constrained to the manufacturing floors. For Gantt, transitioning from manufacturing to project management in the 1920’s was a deliberate attempt to address complex multi-functional projects.
Beyond giving credit to other inventors of this visual method. This story tells how the inventor came to understand the problems they were facing and created tools to help achieve their objectives. Whether it is waterfall diagrams, Kanban boards, Stand up meetings. Leaders are faced with communicating and coordinating across domains to drive action. Working with the teams and understanding the needs and the problems enables a wise leader to apply the right tool to the right job.
I have my preferences in tools that I will default to when initiating a project. I also work with the teams to learn what will work and how best to apply the tools we have at hand. Software development using scrum or agile doesn’t easily transition to Electrical or Mechanical project management. And when all disciplines are involved in a project finding a way to tie them together in hybrid approaches can be the most effective. The Project leader should be seeking tools to influence and focus the tasks at hand to deliver the highest quality results with the least cost and time duration.
- Bart J. Debicki , (2015),”Forgotten contributions to scientific management: work and ideas of Karol Adamiecki”, Journal of Management History, Vol. 21 Iss 1 pp. 40 – 67
One Reply to “Could it be Harmonogram Instead?”
Comments are closed.