Rise & Fall of the Network Diagram

PERT, CPM, Gantt. How did the Gantt chart become the defacto standard in representing a project schedule? In the realm of projects I have worked on, other than in academic settings, I’ve never contributed to or applied PERT/ CPM network diagrams in real life. That is not to say that we didn’t apply concepts of those methodologies in our planning and controls. Certainly, estimating, identifying task relationships, and critical paths are a core to project planning and control. But illustrating the project via a PERT or CPM diagram was not the method. That method was the Gantt chart. Why was that? What lead to the Gantt chart being the method / tool for illustrating a project’s schedule and status?

At the start of the 20th century, industrialization, manufacturing and supply chain complexities were combining with emerging management philosophies. Harry Gantt and Karol Adamiecki were promoting a waterfall bar-charting tool for manufacturing scheduling. This scheduling method did make its way from the production floor to project management, most notably in 1931 on the Hoover Dam project5.

By Mid-century, specific emphasis was focused on project planning, control and reporting. Questions were being asked about task relationships and validity of progress that Gantt wasn’t easily able to answer. The late 50’s produced CPM (Critical Path Method) and PERT (Program Evaluation Review Technique). These diagraming and control tools share many similarities and are often discussed together.

The Project Management Institute (PMI.ORG) has a nice oral history from the CPM creators (James E. Kelly, Morgan R. Walker, and John S. Sayer). In this recounting of CPM, corporate factors drove the need to better plan and execute factory turnaround at DuPont. There was enough executive sponsorship for them to demonstrate early concepts and apply them to a trial project. In this recounting of the CPM history, the team was given the task to improve scheduling related to design & construction of chemical plants, to reduce the cost and duration of those projects.

PERT Chart critical path and event dependencies, https://utpaqp.edu.pe/explore/pert-chart-for-project – Creative Commons

Somewhat simultaneously, the US Navy was attempting to answer similar questions around the Polaris Missile development program and so the Navy’s Office of Special Projects, enlisted the help of Booz-Allen Hamilton and Lockheed Corp to develop a method for assessing the validity of a schedule and reviewing the progress against that schedule to determine the probability of meeting the project objectives.

The complexities of managing multiple construction trades, factory layout, machine development, military subcontractors, multiple system designs was beyond what manual project management could manage. Let alone once a schedule was planned, and work started, changes inevitably began. And changes in a manual plan of thousands of lines required massive amounts of resources to update. That updating and maintaining could mean deadlines were missed before it was even known that a task was at risk.

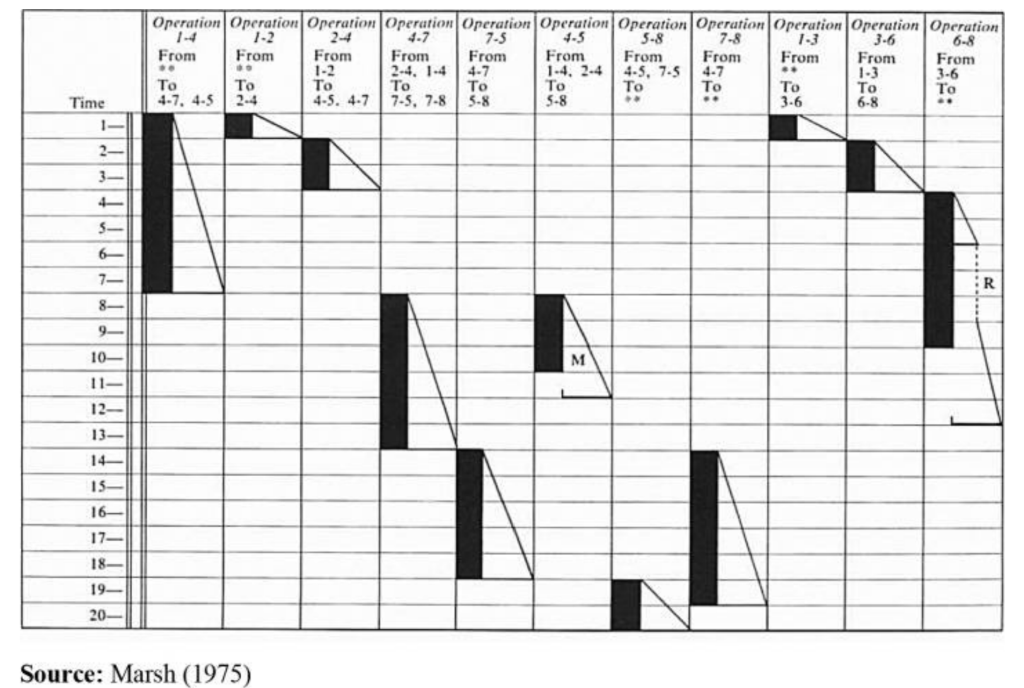
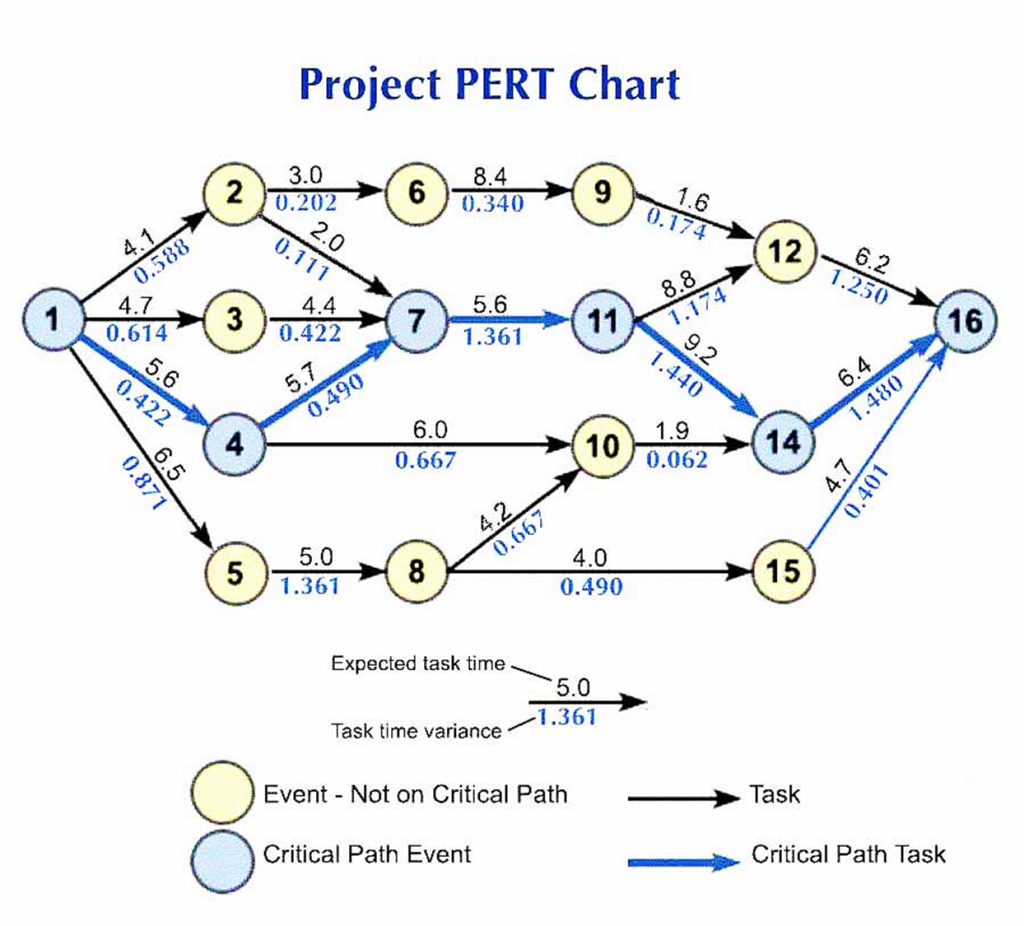
Team CPM realized computers were the answer and their development started with computer support from the beginning2. Team PERT approaching from a different mathematical model also started with computer support in mind3. Thus began the efforts to illustrate a project’s tasks, durations and interdependencies in a way that allowed computational efficiency. These network diagrams evolved to make computer data entry easier, collect variables in a rational order and report out on those calculations. It was not necessarily the most intuitive way to illustrate the plan. As shown in the figure above, a casual observer would have difficulty interpreting a projects status.

That intuitive illustration had already been demonstrated by the Gantt chart. The largest example of Gantt chart use in project management was the Hoover Dam from 1931 to 19365. That was 20 years before CPM & PERT were to be developed! Since the turn of the 20th century the bar chart (Gantt Chart) was incorporated to aid manufacturing scheduling. It was easy to follow and to interact with. What it wasn’t good at was showing interdependencies, calculating critical path or capturing the logic behind the schedule. So, from a user perspective Gantt charts were great, from a maintenance and accuracy perspective they were lacking. And the gap wasn’t in the way the project was illustrated, it was in the way the project variables were captured and maintained. It could be done, but at great cost to speed and manpower.

PERT / CPM answered the gaps in what the Gantt chart couldn’t illustrate but it required specialized training and support to organize and feed data to the computer. The typical bar chart had to be deconstructed and important data and network relationships reorganized so punch cards could be created for loading into the UNIVAC computers. Project Planning teams were working for the computer to help make the computer work for them.

They were never going to rise because those methods catered to the computer’s requirements and not the users

The interesting point to here is that the development of PERT/ CPM was closely tied to the computational needs at the time. The need to feed the computer information in a way to support the mathematical models informed how the networks would look and work. In contrast Gantt charts were easy to build and understand but lacked the mathematical logic and successor/ predecessor dependencies that PERT / CPM did. As computer technology evolved; schedule, analysis and CPM management was absorbed into the Gantt chart method because that was more user friendly.

Example: Modern Gantt Chart https://www.usemotion.com/blog/gantt-chart

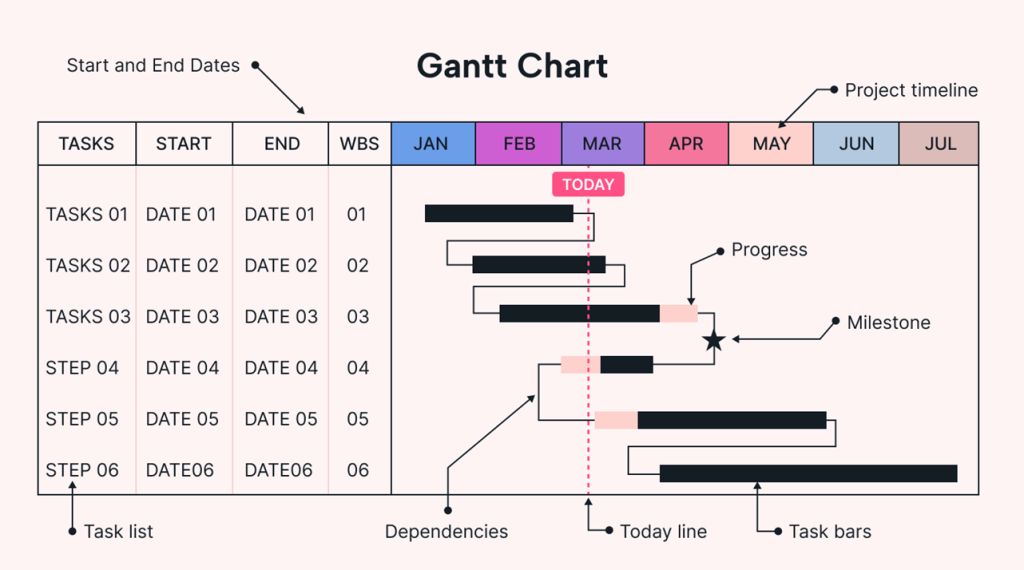
Today the PERT/ CPM math is embedded into and behind the Gantt chart user interface. We estimate, update, connect & disconnect dependencies all through Gantt chart interfaces. In a blink of an eye the network is updated, and the results are show in a clear schedule. A task turns red, it’s on the critical path. End milestones moved ,the impact is immediately visible. I think had computing technology been available at the onset of the Gantt chart, the PERT & CPM methods would have been applied directly to Gantt charts for project management.

There never was a rise and fall of PERT/ CPM. They were never going to rise because those methods catered to the computer’s requirements and not the users who needed to use the output of those calculations to manage their projects. The progress of computer technology and the incorporation of the complex math behind network scheduling democratized who could use these tools and for what projects4.

In my experience as a PM, being able to engage the team in the planning cycle in a way that is easy to understand and comprehensive pushes project ownership throughout the team. Similarly, being able to utilize the project management tools to report out and manage the critical dependencies frees time for the project manager to actually manage the project (remove barriers, identify constraints and support the teams responsible for the tasks).

References:

  1. Jack R. Meredith, Samual J. Mantel, “Project Management – A Managerial Approach- Second Edition”, Copyright: 1989 John Wiley & Sons, Inc.
  2. Project Management Institute, “Origins of CPM”, 1989, Origins of CPM – a Personal History | PMI
  3. Project Management Institute, “Some Reflections on PERT Project Management”, 1990, Some Reflections on PERT and Project Management | PMI
  4. Mosaics Projects, “A Brief History of Scheduling”, 2006 Microsoft Word – P042_History_of_Scheduing
  5. McNeil Engineering. “Project Management Lessons from the Hoover Dam.” , 2025, Project management lessons from the Hoover Dam: What engineers can learn from history – McNeil Engineering

Could it be Harmonogram Instead?

We know it today as the Gantt Chart, but historical research credits a visual network diagram of inter-related activities was illustrated as early as 1896, by Karol Adamiecki. A Polish engineering and management researcher, Adamiecki developed the Harmonogram technique while working on steel mill production challenges1 in Poland & Russia at the turn of the 20th century.

What was the problem that the Harmonogram solved? Adamiecki’s job at that time was investigating plate steel mill production. Attempting to improve productivity. His observations led him to believe there were opportunities for improvement, but his initial attempts to implement these ideas were met with resistance from the work force. Being seen as an outsider with limited knowledge of that specific factory would cloud the openness to change. He needed a tool to help him communicate his observations and illustrate how change could lead to improved productivity. At that time there was no apparent right tool for the job. So, he invented one. The Harmonogram.

Harmonogram, Karol Adamiecki, illustration of work center activity, duration and relationship to other work center activities
Harmonogram, Karol Adamiecki (Marsh 1975)1

Creating a graphical representation of work activity, duration and relation to other operations he was able to illustrate where time and productivity was lost. This new tool, enable him to gain the influence necessary to implement changes, not just at his primary factory but also in Russia.

In the Western world, Henry Gantt is credited with the invention of this graphical tool. But both men developed their initial solutions from steel and manufacturing backgrounds. With the demonstrated success in the factory, taking their management principals and charts to other forms of industry was a natural next step. The idea of integrating activities and illustrating them graphically wasn’t only constrained to the manufacturing floors. For Gantt, transitioning from manufacturing to project management in the 1920’s was a deliberate attempt to address complex multi-functional projects.

Beyond giving credit to other inventors of this visual method. This story tells how the inventor came to understand the problems they were facing and created tools to help achieve their objectives. Whether it is waterfall diagrams, Kanban boards, Stand up meetings. Leaders are faced with communicating and coordinating across domains to drive action. Working with the teams and understanding the needs and the problems enables a wise leader to apply the right tool to the right job.

I have my preferences in tools that I will default to when initiating a project. I also work with the teams to learn what will work and how best to apply the tools we have at hand. Software development using scrum or agile doesn’t easily transition to Electrical or Mechanical project management. And when all disciplines are involved in a project finding a way to tie them together in hybrid approaches can be the most effective. The Project leader should be seeking tools to influence and focus the tasks at hand to deliver the highest quality results with the least cost and time duration.

  1. Bart J. Debicki , (2015),”Forgotten contributions to scientific management: work and ideas of Karol Adamiecki”, Journal of Management History, Vol. 21 Iss 1 pp. 40 – 67

Project Fog – Continued – Coping with early-stage Project Uncertainty

I want to expand on my first post in the Project Management Series, about what I called Project Fog. In that first post I mention the role of the Project Manager (PM). But what are some causes of the foggy front end of a project?

First, some background. I’ve been fortunate to lead projects ranging from ERP implementations, product development projects and business integrations. You can peruse my LinkedIn profile to see more details. All this to say that I draw from experience across differing industries and functions. It’s an observation and a style that has worked for me and maybe will for you too.

What is Project Fog? An Example…

Things that might make project uncertain and create a fog for the team. Inhibiting early progress.
An ERP project I worked on had a desired go live date. As the team assembled each team member made assumptions of what modules would be part of go live and what go be added in future dates. If this is not caught early enough in the process teams will begin working with consultants on configurations without sound coordination. Unnecessary work get started consuming resources and or other configurations would have to be reworked.
It’s a simple example of team uncertainty and clarity in requirements can create fog.

A product development example; could occur during market introduction. Assumptions about which markets a product would be released to first will drive documentation, SW UI and compliance work. Market dynamics might shift the priorities creating uncertainty in how resources are planned and schedule impacting progress or resource scheduling.

The Foggy front-end boils down to two main components; Team and Requirements. How do you construct a team if you don’t know the requirements? How do requirements get refined if you don’t know the team? Compounding the fog, the PM isn’t always first on the scene. There is enough clarity of what the end might look like, but getting from where we are today to that utopian goal is foggy.

AI Generated scene illustrating an early RPG game with fog obscuring details.

I liken Project Fog to an early RPG video game, where the computer and graphics engines aren’t powerful enough to render an entire scene with the clarity and detail the player would want or need. Thus, the player only sees enough detail as relevant at the time. As they walk through the world, the fog moves away revealing more detail necessary for the game to proceed. Maybe an Ogre over there (stay away), and sword over here (pick it up), a pool of healing potion (remember where it is for later). As the game proceeds, the player gains more clarity to what they and who they need on their adventure. Where they will go and how the team will achieve their goal.

Similarly with a project, but it isn’t just one player. It’s a team. The Project Manager is leading that team. What appears to be clear for one team member may not be clear for another. And clarity could be lost from one scene to the next. The PM plays a huge role in providing the clarity between team members. And also knowing when to step out of the scene and let the team work the project tasks directly.

The team sets forth, still recognizing that there will be fog…

The PM also builds the map (project plan if you will). Working with leadership to define the initial scope, and goals then sharing with the team. Building these initial maps helps the PM, and leadership identify the team. As the teams takes form requirements are refined and team members adjusted. The map at times looks complete but realizing it is dynamic the PM is always prepared to adjust.

One of the most powerful tools to the PM in this stage; communication. Up, Down & side to side. I’ve often referred to this as the PM translating English to English. But that is a topic for another beer. Communication is the sunlight that burns the fog off the foggy front end and enables the team to start cranking on the project. The speed at which the fog can be burned off the sooner the project really starts to move.

Essentially the PM is building out team and requirements a bit iteratively. That map is the requirements, it’s not complete, can’t be complete (because it’s foggy), but is complete enough to build a team. The team adds to the map, identifying new requirements and so on.

At some point there is enough team and enough map to begin the journey. The team sets forth, still recognizing that there will be fog and being prepared to continue to tackle the fog makes the team stronger. The fog burns off, and the journey proceeds at a faster pace.

By recognizing there will be fog and knowing what forms that fog, we as PM’s are better prepared to deal with it, inform and educate leadership, build trust in our team, to tackle the tasks at hand.

Project Fog

Projects are foggy beasts. They often are initiated with grand aspirations and bold proclamations. Simple elevator speeches or sharp pitch books are necessary to get the spark to get a project moving. But as the team is assembled and the flash fades from the spark, Project Fog begins to set in.

Recognizing Project Fog is a key task of a Project Manager. Establishing scope and even rudimentary project plans take form and drive away the fog, giving clarity to the project team. The Project Manager applying these tools leads the team through those first steps of a project. Then Reassess where the team is and where it came from. Seek more clarity, adjust and take the next steps.

Constantly progressing, re-evaluating and adjusting can build momentum, small wins become big gains and the team starts performing with intent.